UniversalDashboard.UDPivotTable
psdevuk
UD-Pivot
A powershell version of https://github.com/plotly/react-pivottable
Please Note
The version on the powershell gallery I called New-UDPivotTable the exact same rules apply apart from the function name.
My Reason For This Component
At my work I always seem to find that I have to put the raw data into a prettier format. Obviously UniversalDashboard does a great job in making this happen. But for instance when it comes to the sales team and you show them a grid but that grid has 1420 results or more, then you have to show them how to to export that data to excel, then all the steps involved to put that into a pivot table within excel. Just so they can have the data grouped better and not so many rows to digest. Well you know they are not going to remember, or simply carry on asking you. So this is how I plan to tackle that issue through the use of New-UDPivot an interactive dynamic pivot table/graph component.
Parameters
- -Data This is the only parameter in this component this is a mandatory paramater, as without this being supplied there will be no data to display
The Data Parameter Has To Be A HashTable
So the trick with passing the data to this component is it has to be in a hashtable format. This component works wonders displaying SQL data, but for this example I will show how to put the output of get-process into a hashtable
 $Processes = Get-Process | sort-object CPU -Descending | Name, CPU, WorkingSet, VirtualMemorySize, StartTime
                $DataHash = @()
                foreach ($item in $Processes) {
                    $DataHash += @{
                        Name              = $item.Name
                        CPU               = $item.CPU
                        WorkingSet        = $item.WorkingSet
                        VirtualMemorySize = $item.VirtualMemorySize
                        StartTime         = $item.StartTime
                    }
                }
Now the variable $DataHash can be passed to the component like so New-UDPivot -Data {$DataHash} Literally that's is all there is to passing the data to this component
Demo Of The Component
Import-Module -Name UniversalDashboard
Import-Module -Name UniversalDashboard.UDPivot
Get-UDDashboard | Stop-UDDashboard
$theme = Get-UDTheme -Name Default
Start-UDDashboard -Port 1000 -AutoReload -Dashboard (
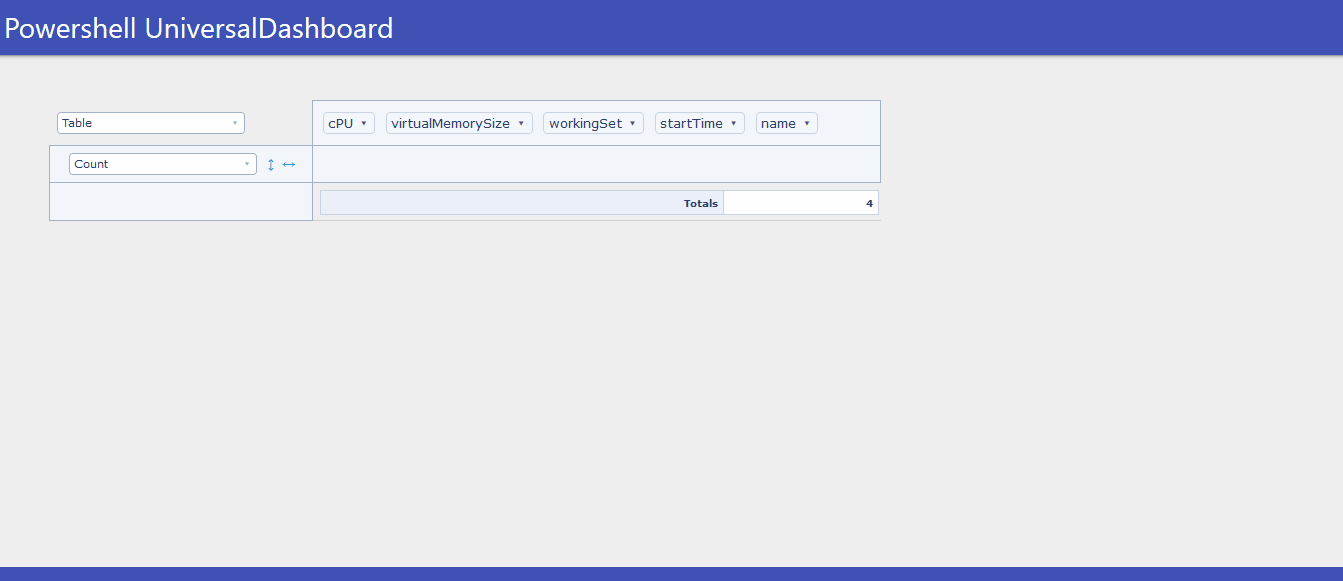
New-UDDashboard -Title "Powershell UniversalDashboard" -Theme $theme -Content {
New-UDRow -Columns {
New-UDColumn -Size 8 -Content {
###For DEMO purposes selecting the top 4 CPU processes on my local machine###
$Processes = Get-Process | sort-object CPU -Descending | Select-Object -first 4 Name, CPU, WorkingSet, VirtualMemorySize, StartTime
###Now we need to convert the data we want to show in New-UDPivot into a hashtable, so for this example that would be####
$hash = @()
foreach ($item in $Processes) {
$hash += @{
Name = $item.Name
CPU = $item.CPU
WorkingSet = $item.WorkingSet
VirtualMemorySize = $item.VirtualMemorySize
StartTime = $item.StartTime
}
}
###Once you have all your data in a hashtable format simply pass that to New-UDPivot -Data parameter in a scriptblock###
New-UDPivot -Data { $hash }
}
}
}
)
Then simply drag and drop for how you wish your data to be displayed.

Install-Module UniversalDashboard.UDPivotTable
1.0.1
Saturday, January 18, 2020
universaldashboard ud-dashboard ud-component ud-pivottable
psdevuk
dashboard Component