UniversalDashboard.UDFinancialChart
Darren Robinson
UniversalDashboard.UDFinancialChart


React-Stockcharts for Universal Dashboard.
Available in the PowerShell Gallery
Install
Install direct from the PowerShell Gallery (Powershell 5.x and above)
install-module -name UniversalDashboard.UDFinancialChart
DESCRIPTION
v1.0.3 Code Signed and 2 additional charts. Candle Stick Stock Scale Chart with Volume Bar and Candle Stick Chart with Edge.
v1.0.2 includes another 4 additional charts Candle Stick Chart with SAR, Candle Stick Chart with Gann Fan, OHLC Chart with Elder Ray Indicator and OHLC Chart with Elder Impulse Indicator.
v1.0.1 includes 4 additional charts Candle Stick Chart with MACD Indicator, Candle Stick Chart with RSIIndicator, Candle Stick Chart with Bollinger Band Overlay and Candle Stick Chart with MA.
v1.0.0 Candle Stick Chart with Full Stochastics Indicator, Moving Average Cross Over Algorithm V2 and Candle Stick Chart for Continuous IntraDay
Example Charts
Universal Dashboard Component Syntax
Default Chart (MovingAverageCrossOverAlgorithmV2)
New-FinancialChart -stockData "http://localhost:10010/StockData.csv"
MovingAverageCrossOverAlgorithmV2 Chart
New-FinancialChart -stockData "http://localhost:10010/StockData.csv" -chartType 'MovingAverageCrossOverAlgorithmV2'
INPUTS
(required) stockData - CSV delimited Stock Data
(case sensitvie and ordered) Header Columns are;
```
Open,High,Close,Low,Volume,Date
```

Date format MUST be dd-mm-yyyy (e.g 17-01-2017) except for CandleStickChartForContinuousIntraDay ( date format MUST be in <dd-mm-yyyy hh:mm:ss> ). Days less than 10 must be 0 padded. e.g 01-12-2020 for 1 Dec 2020.
Transform the data using PowerShell something like this;

* 1 Year Stock History Data Transformation, remove double quotes, date into <dd-mm-yyyy> format
```
$1y | Select-Object | ConvertTo-Csv -NoTypeInformation -Delimiter "," | ForEach-Object { $_ -replace '"', '' } | ForEach-Object { $_ -replace '/', '-' } | ForEach-Object { $_ -replace ',1-', ',01-' } | ForEach-Object { $_ -replace ',2-', ',02-' } | ForEach-Object { $_ -replace ',3-', ',03-' } | ForEach-Object { $_ -replace ',4-', ',04-' } | ForEach-Object { $_ -replace ',5-', ',05-' } | ForEach-Object { $_ -replace ',6-', ',06-' } | ForEach-Object { $_ -replace ',7-', ',07-' } | ForEach-Object { $_ -replace ',8-', ',08-' } | ForEach-Object { $_ -replace ',9-', ',09-' } | out-file -encoding ASCII "C:\chartdata\StockData.csv"
```
(optional) chartType - defaults to MovingAverageCrossOverAlgorithmV2 "CandleStickChartWithFullStochasticsIndicator", "MovingAverageCrossOverAlgorithmV2", "CandleStickChartForContinuousIntraDay"
Stock Data is retrieved from a local URL
Requires a small NodeJS WebServer to serve up the Stock Data Files. Makes it easy to reference the data Example
Syntax
node server.js <path_to_stockdata> port
Example
node server.js 'C:\chartdata' 10010
Example Universal Dashboard
import-module UniversalDashboard.Community
import-Module UniversalDashboard.UDFinancialChart
Get-UDDashboard | Stop-UDDashboard
$Theme = New-UDTheme -Name "darrenjrobinson" -Definition @{
'.dropdown-content' = @{
'min-width' = '450px'
}
'.btn-floating' = @{
'background-color' = '#26a69a'
}
'.collection .collection-item' = @{
'line-height' = '1.0rem'
'padding' = '5px 10px';
}
'.ud-grid' = @{
'color' = '#ffab40'
}
'.card, .card-panel' = @{
'color' = '#ffab40'
}
'.card .card-action a:not(.btn):not(.btn-large):not(.btn-small):not(.btn-large):not(.btn-floating)' = @{
'color' = '#ffab40'
}
} -Parent DarkDefault
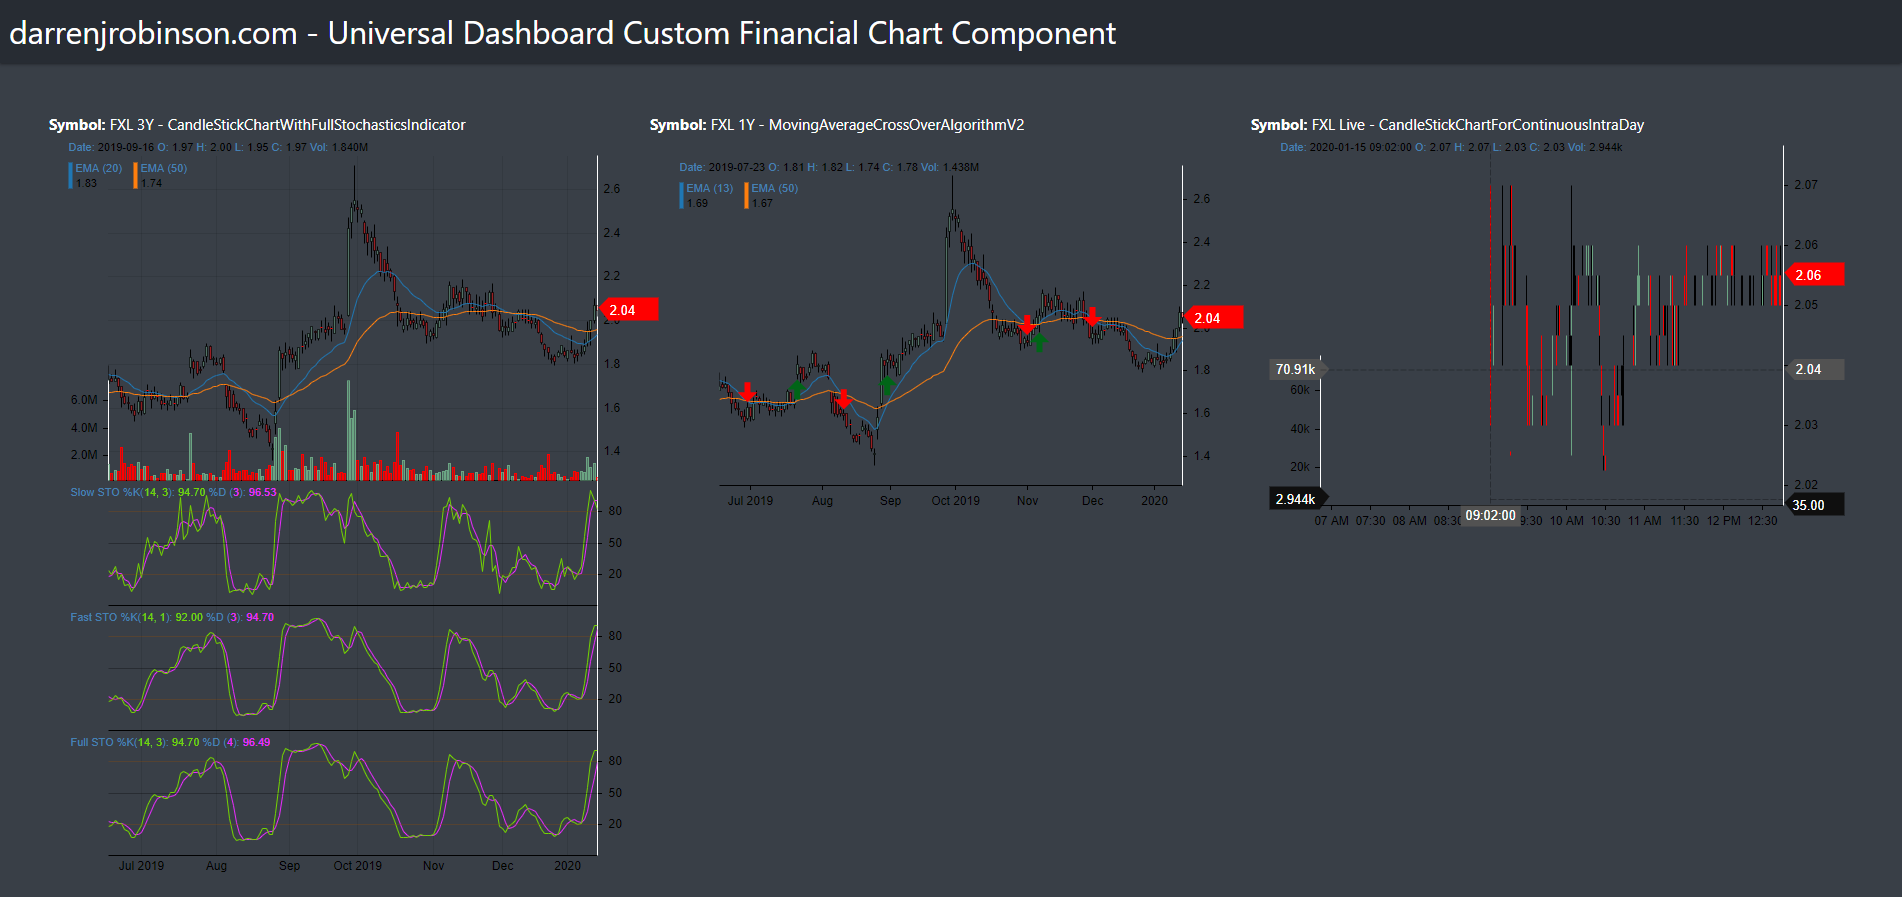
$myDashboard = New-UDDashboard -Title "darrenjrobinson.com - Universal Dashboard Custom Financial Chart Component" -Content {
New-UDLayout -Columns 3 -Content {
New-UDRow -Id "FinChart1" -Endpoint {
New-UdHtml -Markup "<b>Symbol:</b> FXL 3Y - CandleStickChartWithFullStochasticsIndicator</br>"
New-UDRow -Id "CandleStickChartWithFullStochasticsIndicator" -Endpoint {
New-FinancialChart -stockData "http://localhost:10010/FXL-AX-3y.csv" -chartType CandleStickChartWithFullStochasticsIndicator
}
}
New-UDRow -Id "FinChart2" -Endpoint {
New-UdHtml -Markup "<b>Symbol:</b> FXL 1Y - MovingAverageCrossOverAlgorithmV2</br>"
New-UDRow -Id "MovingAverageCrossOverAlgorithmV2" -Endpoint {
Start-Sleep -Seconds 2
New-FinancialChart -stockData "http://localhost:10010/FXL-AX-1y.csv" -chartType MovingAverageCrossOverAlgorithmV2
}
}
New-UDRow -Id "FinChart3" -Endpoint {
New-UdHtml -Markup "<b>Symbol:</b> FXL Live - CandleStickChartForContinuousIntraDay</br>"
New-UDRow -Id "CandleStickChartForContinuousIntraDay" -Endpoint {
Start-Sleep -Seconds 1
New-FinancialChart -stockData "http://localhost:10010/FXL-AX-LiveData.csv" -chartType CandleStickChartForContinuousIntraDay
}
} -AutoRefresh -RefreshInterval 25 # Refresh the Graph
}
} -Theme $Theme
Start-UDDashboard -ListenAddress 127.0.0.1 -Port 11000 -Dashboard $myDashboard -Force
LINKS
- Associated blog https://blog.darrenjrobinson.com/react-stockcharts-for-powershell-universal-dashboard/
- Follow darrenjrobinson on Twitter
Install-Module UniversalDashboard.UDFinancialChart
1.0.3
Thursday, June 18, 2020
universaldashboard ud-component powershell react-stockcharts stockcharts PSEdition_Core PSEdition_Desktop
Darren Robinson
dashboard Component