UniversalDashboard.GoogleBarChart
psdevuk
New-GoogleBarChart
Bar and Column Google charts for UniversalDashboard https://github.com/RakanNimer/react-google-charts
New-GoogleBarChart
Well I did it again and broke some naming convention for this component, without stating the UD bit infront of the control. Again I was thinking you got a barchart in UD but I have seen quite a few people request a horizontal bar chart. As it happens the Google Barchart is horizontal by default. The other cool thing about the Google Barchart is that is only take a boolean value to change it to a stacked graph. So it is like two components in one. What makes this even more cool, is that the Google ColumnChart has the exact same props as the barchart apart from the chart name. So this then allowed me to use the parameter, with two defined values in it, two let you make a horizonatal barchart or a vertical barchart aka a Columnchart. So then as I could now produce a columnchart and a barchart (in my opinion they are the same thing apart from layout) this then gave me a total of 4 different looking charts from one originally designed component.
Parameters
There are quite a few parameters to use, so please read this section to make the best use of the chart:-
-ChartType This allows a selection of Barchart (horizontal) or Columnchart (vertical) to decide the layout, defaults to Barchart
-Data Is again a multi dimension array of two or more. Please see the demo for usage, again you have to give a title to the array
-Width String parameter to set the width of the component this is defaulted to "500px"
-Height String parameter to set the height of the component this is defaulted to "500px"
-Title String value to give your chart a title along the top
-ChartArea String value defaulted to "50%" no need to adjust, only if you want the chart taking up more area space
-Stacked Is a boolean value which is defaulted to $false so if you want to display a stacked chart make sure you pass $true
-BottomTitle String value to set the title at the bottom of the chart
-StartingValue Integer which is defaulted to 0 but if you needed a different start value to display the chart then change this
-VerticalTitle String value to set the title going vertically along the chart
Version 1.0.1 Added Parameters
- -Animation Allows you to select the animation from a validateset
- -AnimationDuration Integer value defaulted to 2000 controls the animation duration
- -LegendFontColor String value to set the legend font colour
- -LegendFontSize Integer to set the font size of the legend text
- -LegendPosition A validateset to allow you to position the legend
- -TitleFontSize Integer value to set the title font size
- -TitleFontColor String value to set the title font colour
- -BackgroundColor Sets the background colour of the chart via a string
Version 1.0.2 Added Parameter
- -Colors Allows you to specify an array of colours to set for your barcharts
Demo
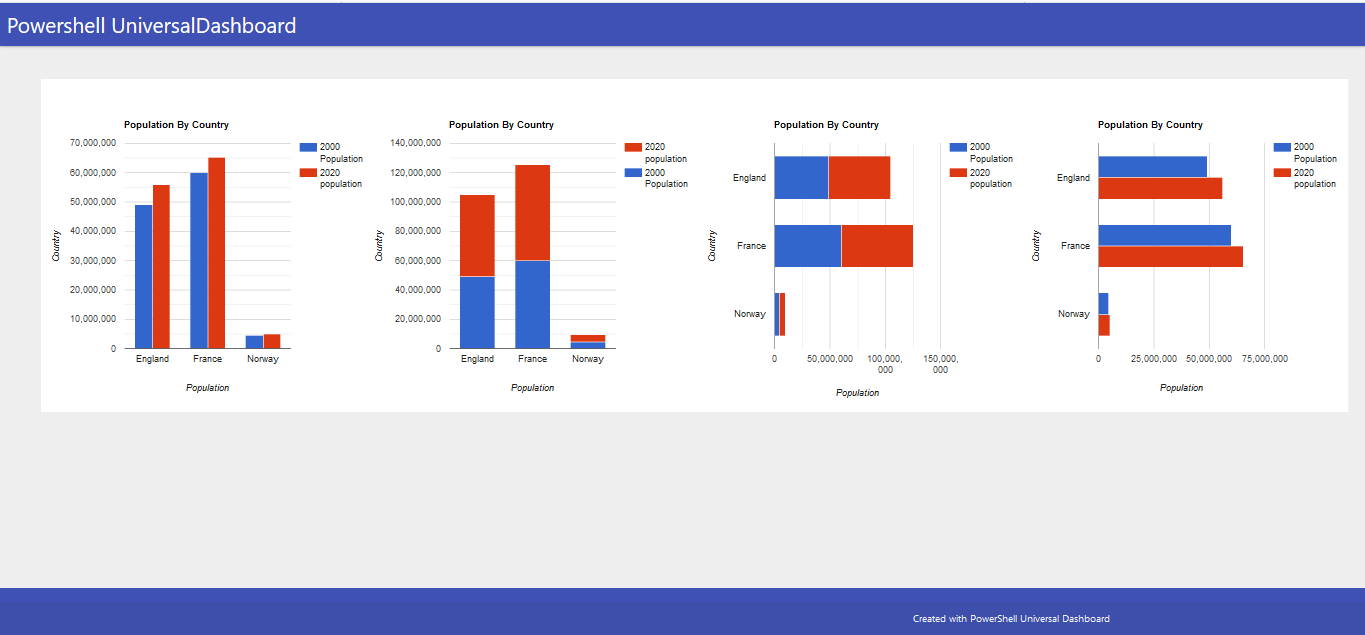
Here is a dashboard showing the same chart data but in 4 different styles:-
Import-Module -Name UniversalDashboard
Import-Module -Name UniversalDashboard.GoogleBarChart
Get-UDDashboard | Stop-UDDashboard
Start-UDDashboard -Port 10005 -Dashboard (
    New-UDDashboard -Title "Powershell UniversalDashboard" -Content {
        $MultiArray = @()
        $MultiArray += , @('Country', '2000 Population', '2020 population' )
        $MultiArray += , @('England', 49023000, 55977178)
        $MultiArray += , @('France', 60051000, 65273511)
        $MultiArray += , @('Norway', 4499367, 5036800)
        New-UDLayout -Columns 4 -Content {
            New-GoogleBarChart -ChartType "ColumnChart" -data @($MultiArray) -Width "500px" -Height "500px" -Title "Population By Country" -BottomTitle "Population" -VerticalTitle "Country"
            New-GoogleBarChart -ChartType "ColumnChart" -data @($MultiArray) -Width "500px" -Height "500px" -Title "Population By Country" -BottomTitle "Population" -VerticalTitle "Country" -Stacked $true -Colors @("#D6BA73", "#8BBF9F")
            New-GoogleBarChart -ChartType "BarChart" -data @($MultiArray) -Width "500px" -Height "500px" -Title "Population By Country" -BottomTitle "Population" -VerticalTitle "Country" -Stacked $true
            New-GoogleBarChart -ChartType "BarChart" -data @($MultiArray) -Width "500px" -Height "500px" -Title "Population By Country" -BottomTitle "Population" -VerticalTitle "Country"  -Colors @("#04080F", "#507DBC")
        }
    }
)
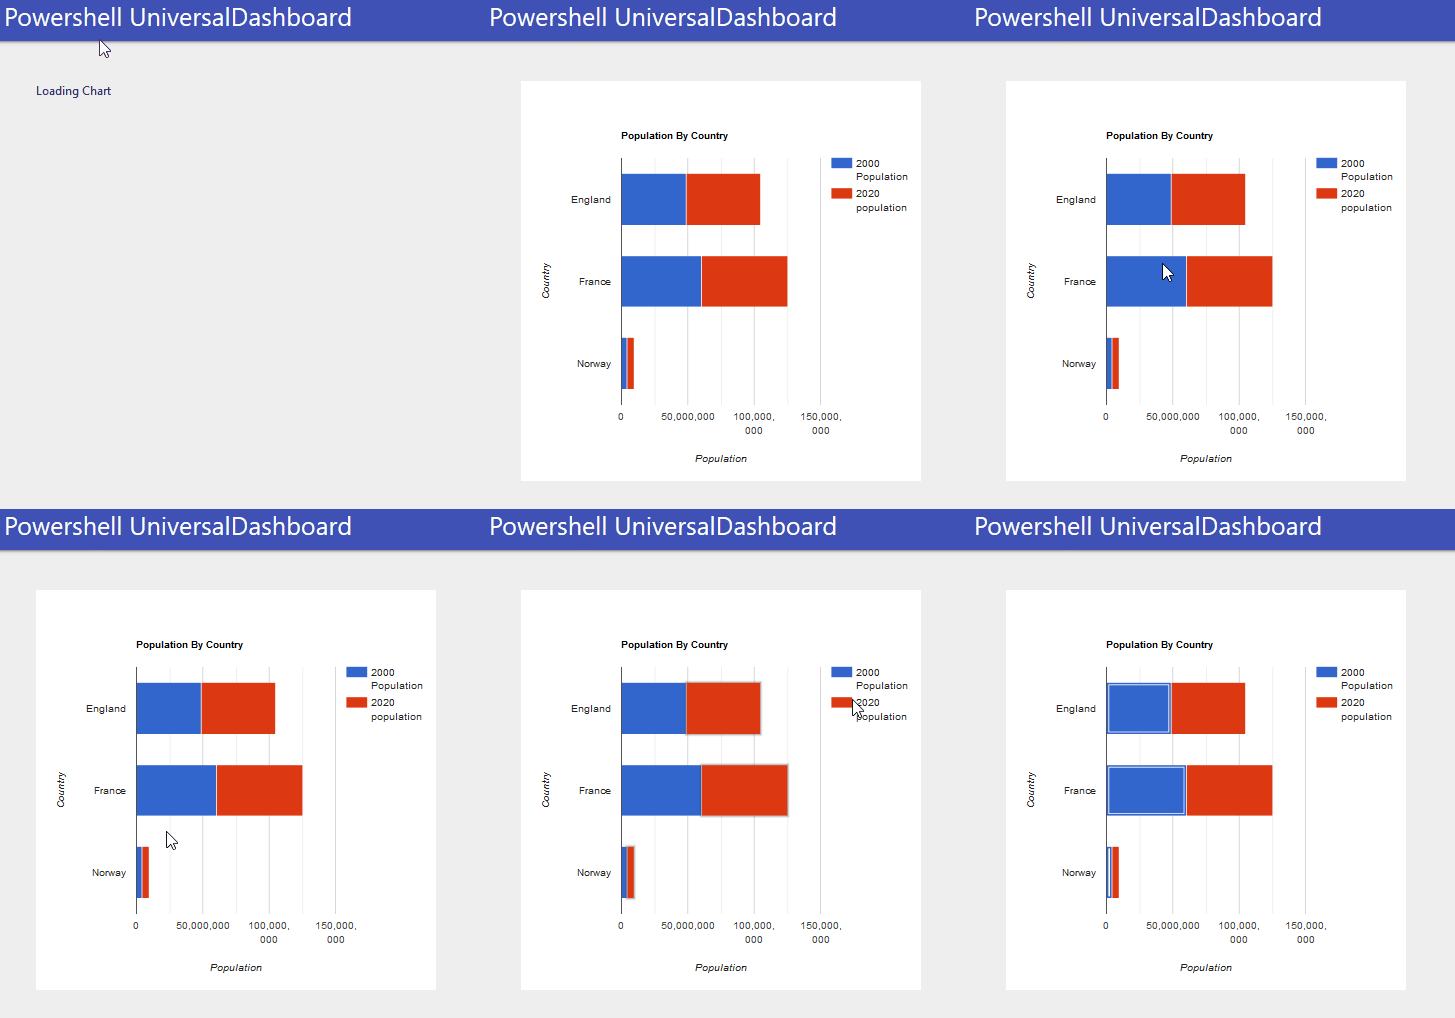
Which as long as you have internet connection as that is required for these charts, you should get the following:-

Show Some Respect
If you are just using universaldashboard.community version think about putting your hand in your wallet/purse and purchase the enterprise edition. I personally own 2 licenses for this, as I think the software is extremely well priced and I know that by buying the product I am helping the developer carry on making the product even better. So please show some respect and go buy your copy of Enterprise edition. I can certainly vouch it is well worth the money and I have been able to produce my company high-end looking dashboards using just my powershell skills, to display the desired information.
Install-Module UniversalDashboard.GoogleBarChart
1.0.3
Wednesday, September 30, 2020
universaldashboard ud-dashboard ud-component
psdevuk
dashboard Component